
At Feldera, we’re religiously focused on performance. And the only way to make sure your software performs well is to profile your code. A lot.
That focus shows up directly in customer results. We recently helped one customer reduce their backfill time for loading 8 billion records in a pipeline with thousands of operators, comprising 1 TiB of data, from 20 hours down to 4 hours. The ability to see bottlenecks via profilers was critical to this effort.
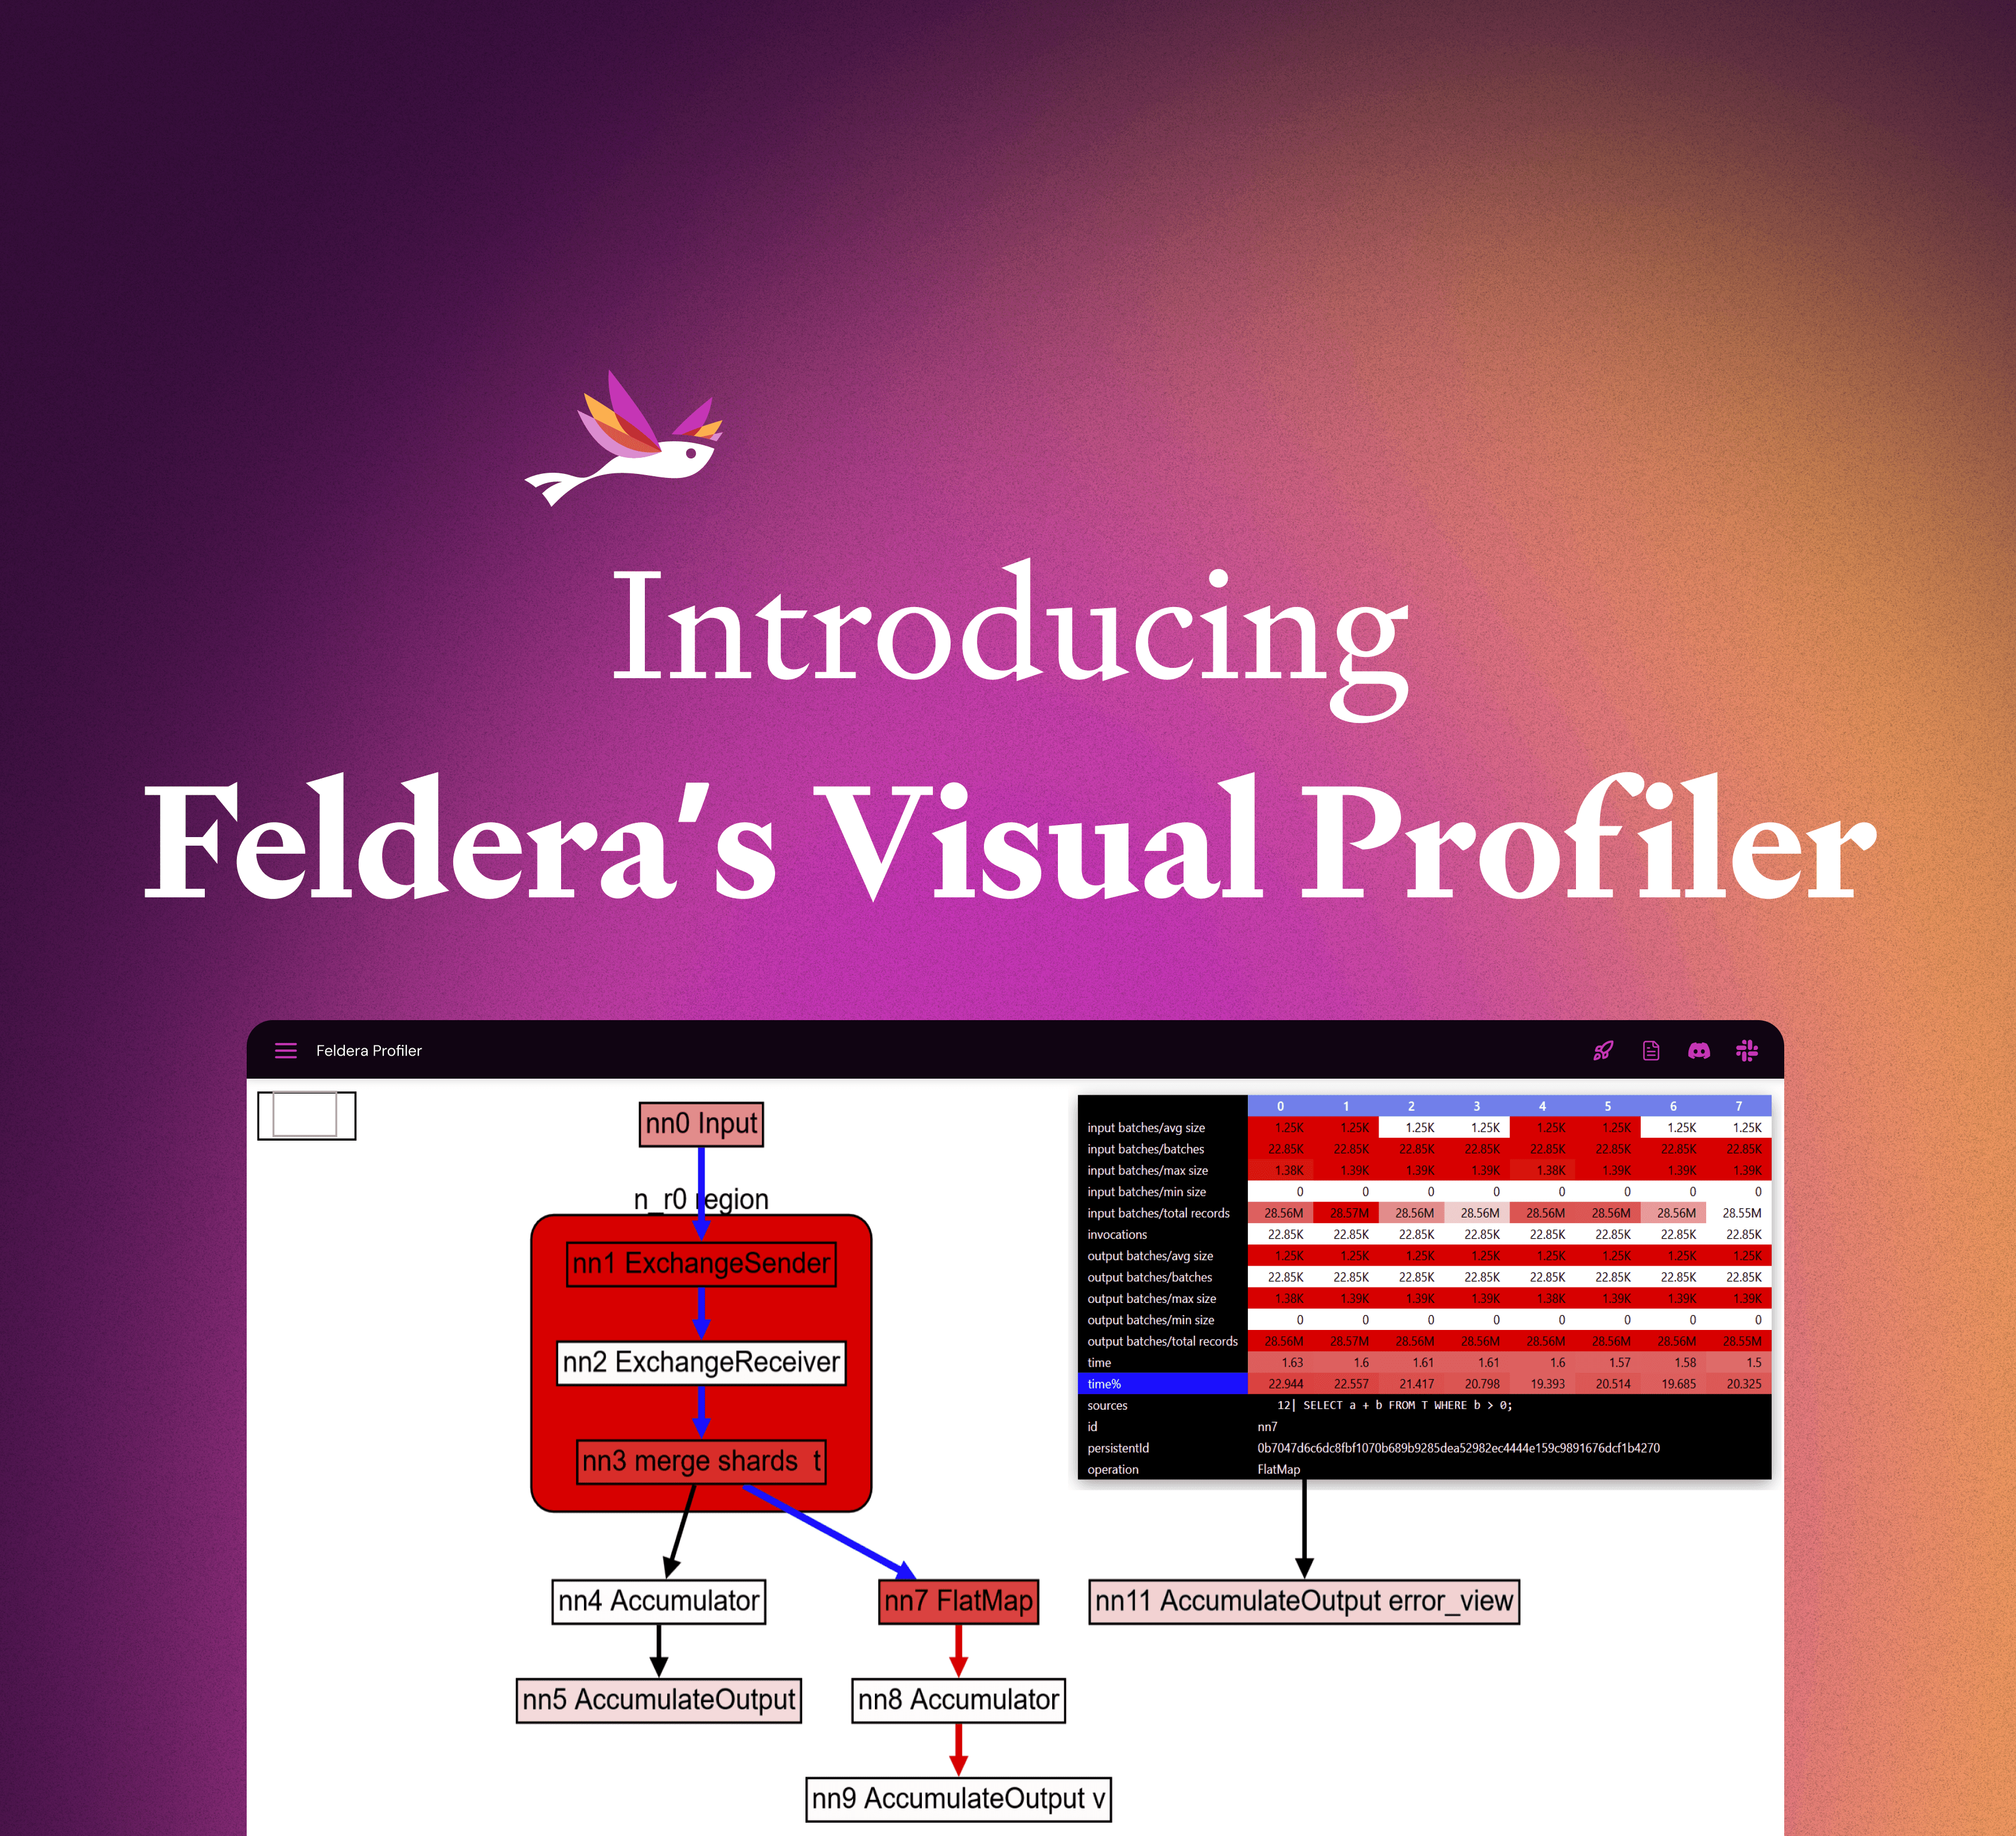
We’ve built a lot of our own profiler tooling. A few months ago we blogged about the visual profiler that we built for the Feldera query engine. This profiler shows how batches of records flow through a Feldera pipeline and allows users and developers to easily discover hot spots and find opportunities for improvement.
Sometimes we need more detail than the visual profiler can show. Then we reach for the kind of profiler that has been a customary developer tool for decades, a code profiler, which several times a second observes what code a program is running and gives us detailed performance insight into both hand-written and compiler-generated code. We integrated the samply profiler with Feldera to make it easy for users to gather code profiles.
For viewing code profiles, Feldera uses Firefox Profiler, which has been adapted beyond its original purpose of profiling Firefox itself. It shows the parts of a program that use the most CPU time, and it can also display network activity and memory usage and when important actions happened, if the profile contains that information.
That’s a big “if”: Firefox gathers that data when it profiles itself, but samply and other code profilers can’t because they don’t have the right information and can’t easily get it. Still, sometimes this information would be invaluable for tracking down performance issues, so we chafed at the omissions.
Back in August, we made a first stab at getting some extra data into code profiles, using a low-level interface that samply provides for outputting “markers,” that is, information about activities that took place in a given timespan. It worked, at the cost of one open file per thread, one system call per marker, and limited output flexibility. These caveats meant that they weren’t very useful, so we hardly used them.
We recently came up with a new approach that overcomes these disadvantages. Feldera now collects timespans for markers internally, and then postprocesses samply’s output to add them. Because Feldera runs samply itself and passes the profiling data to the user, it can transparently run the postprocessing step without any involvement from the user. Feldera only collects marker data when sampling is going on, since Feldera knows when sampling starts and ends.
This meant that we were able to add a lot more of the markers. Now, Feldera profiles show when pipeline steps start and end, when a pipeline evaluates individual operators that compute the contents of views, when merges run in Feldera LSM trees, and, in multihost pipelines, when data is exchanged over the network between hosts. We’ve also been able to refine profile output in smaller ways, such as by adding the pipeline name to the profiler output and by fixing truncation of long thread names that otherwise happens with samply.
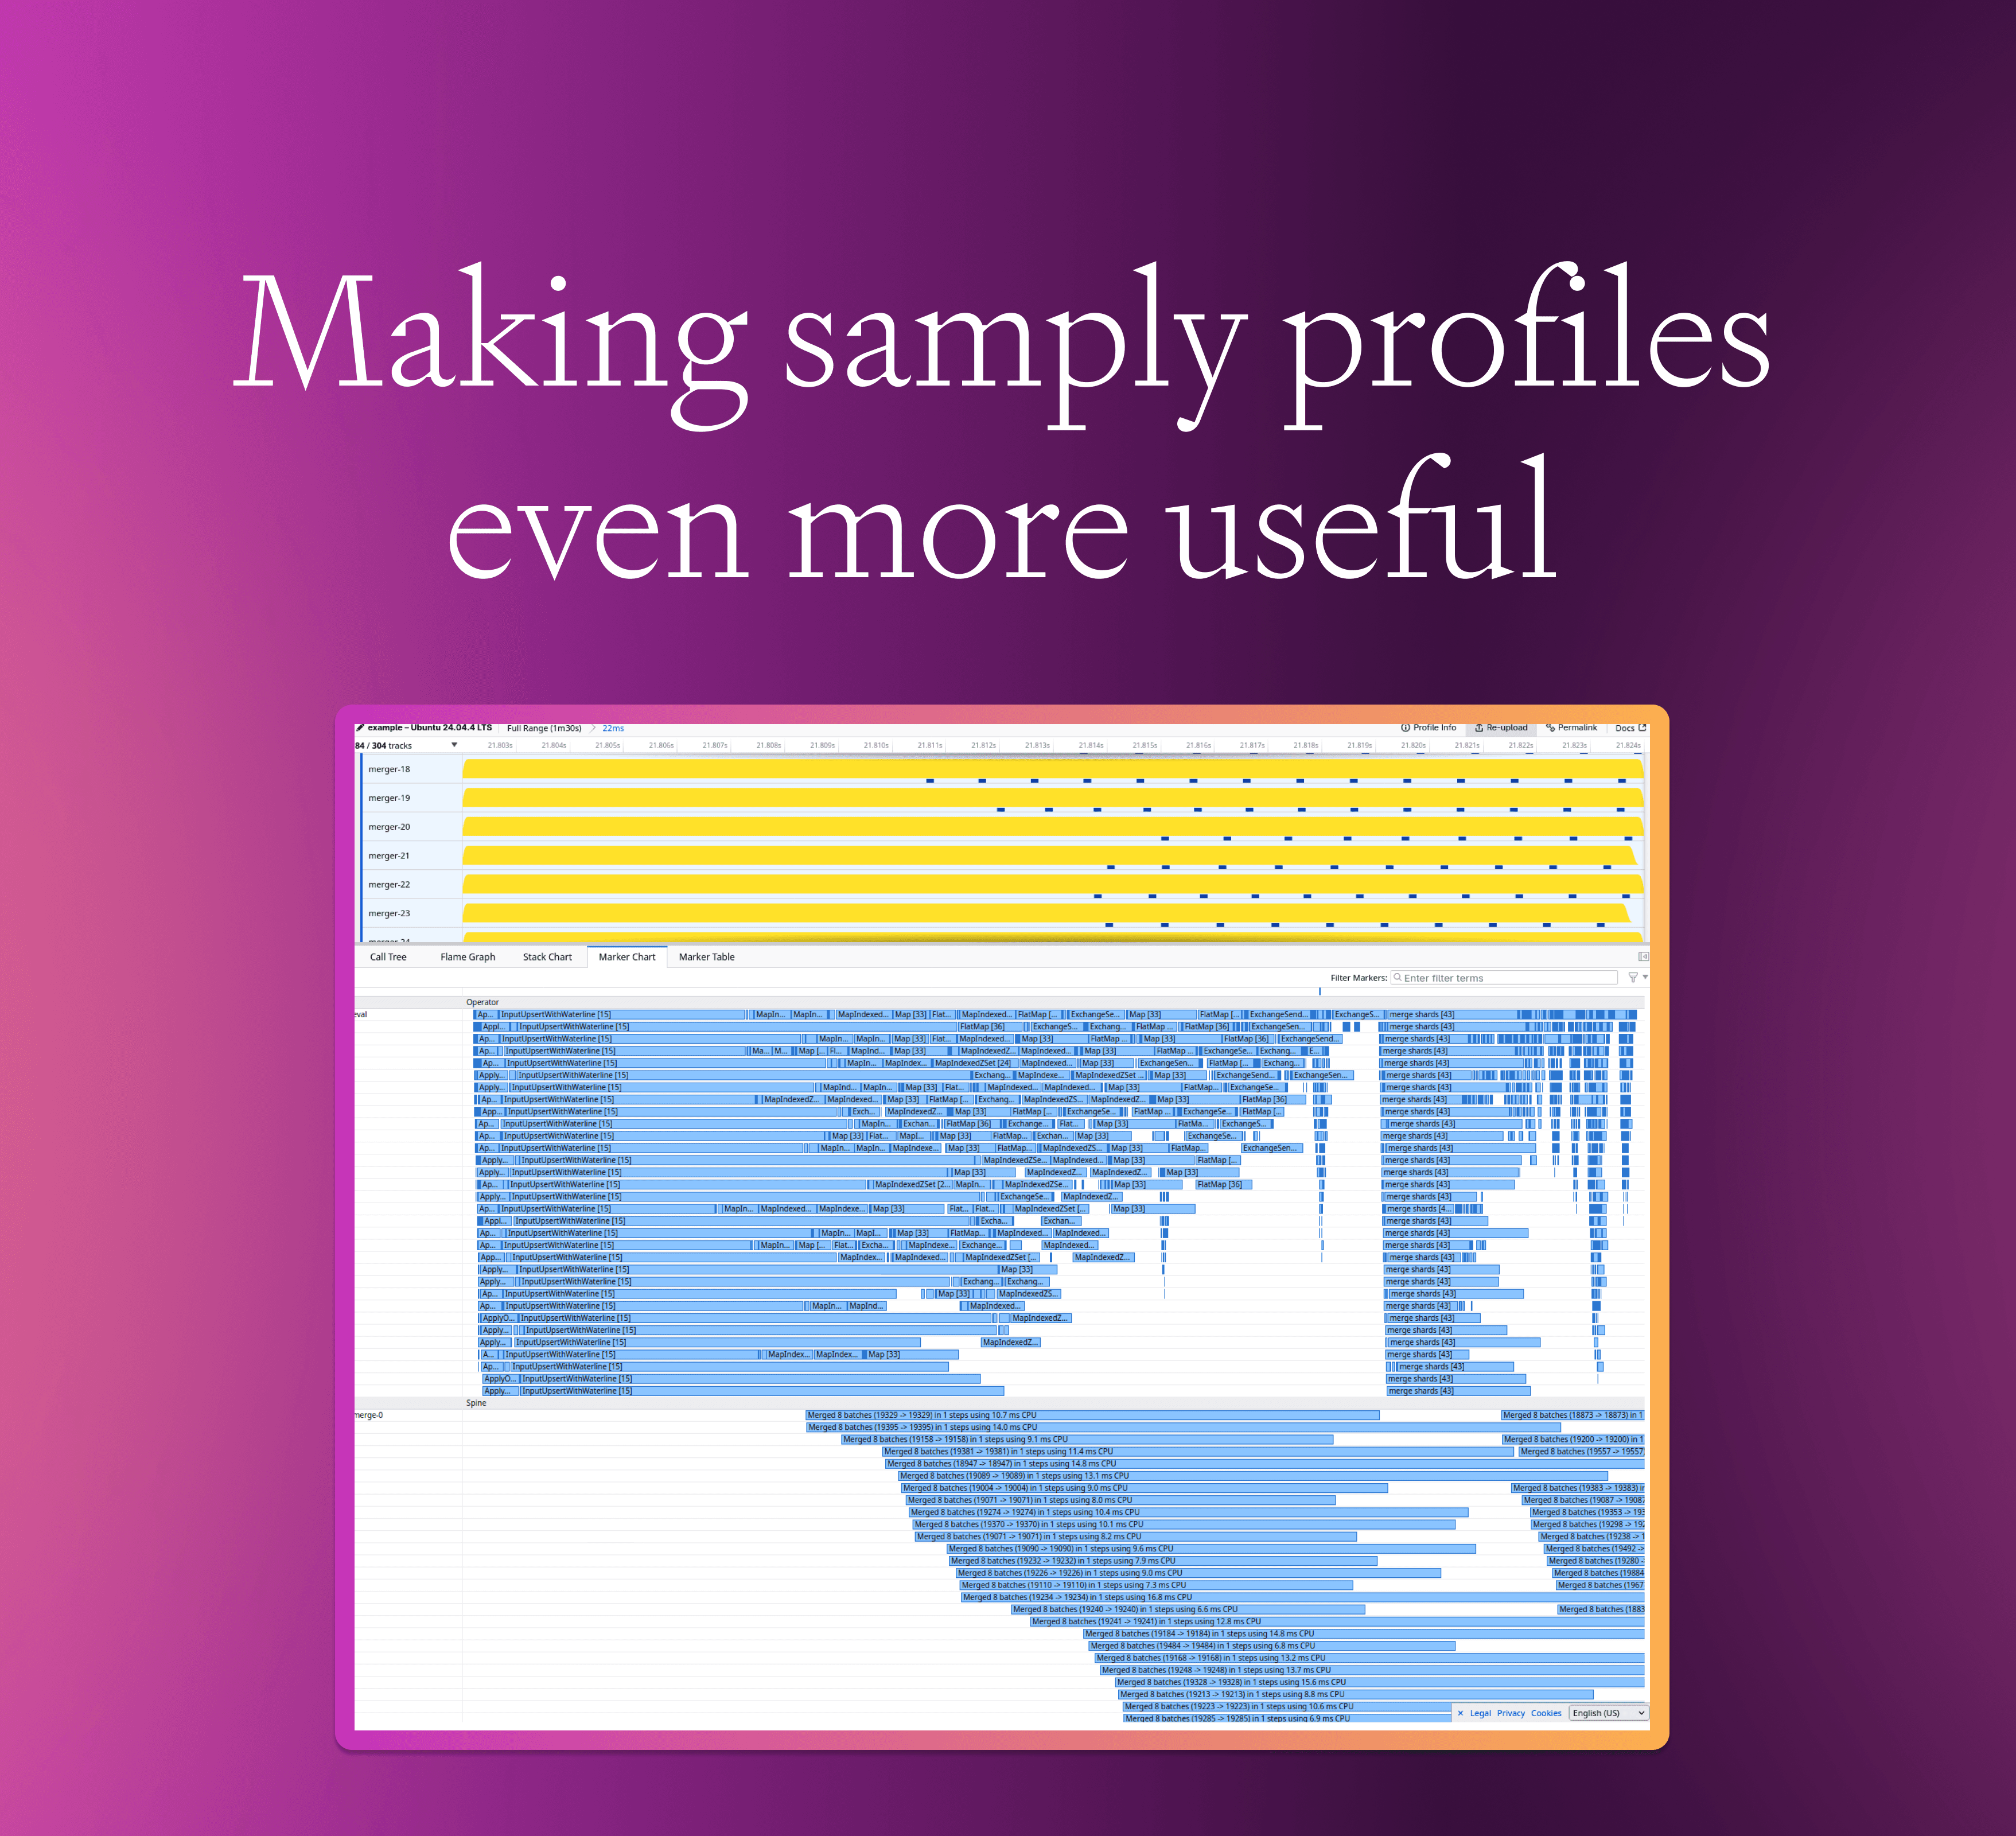
Here’s an example screenshot. It shows the activity of Feldera operators and mergers during one particular computational step. That’s only a small subset of the information available, both by thread and by time. Firefox Profiler makes it easy to upload and share profiles, so we’ve shared this one at https://share.firefox.dev/47siFx6 for you to explore if you wish.

Another refinement we’ve implemented is that profiles of multihost pipelines now include a profile for each of the hosts, rather than just a profile for the first host. The user can view profiles for all the hosts side-by-side and zoom all of them into the same pipeline step to see the effects of, for example, network latency between hosts. As future work, we are considering writing an additional postprocessor that can merge the per-host profiles into a single multihost profile, so that they can be viewed together instead of side-by-side.
Currently, Feldera’s implementation of samply postprocessing is integrated into our dbsp crate, but the code and the approach could apply more broadly. As we continue to improve and refine it, one consideration is to break it out into a separate crate that could also be used by others. We’d love to hear from others who would be interested in using such a crate. Come tell us in our Slack community.