Tour
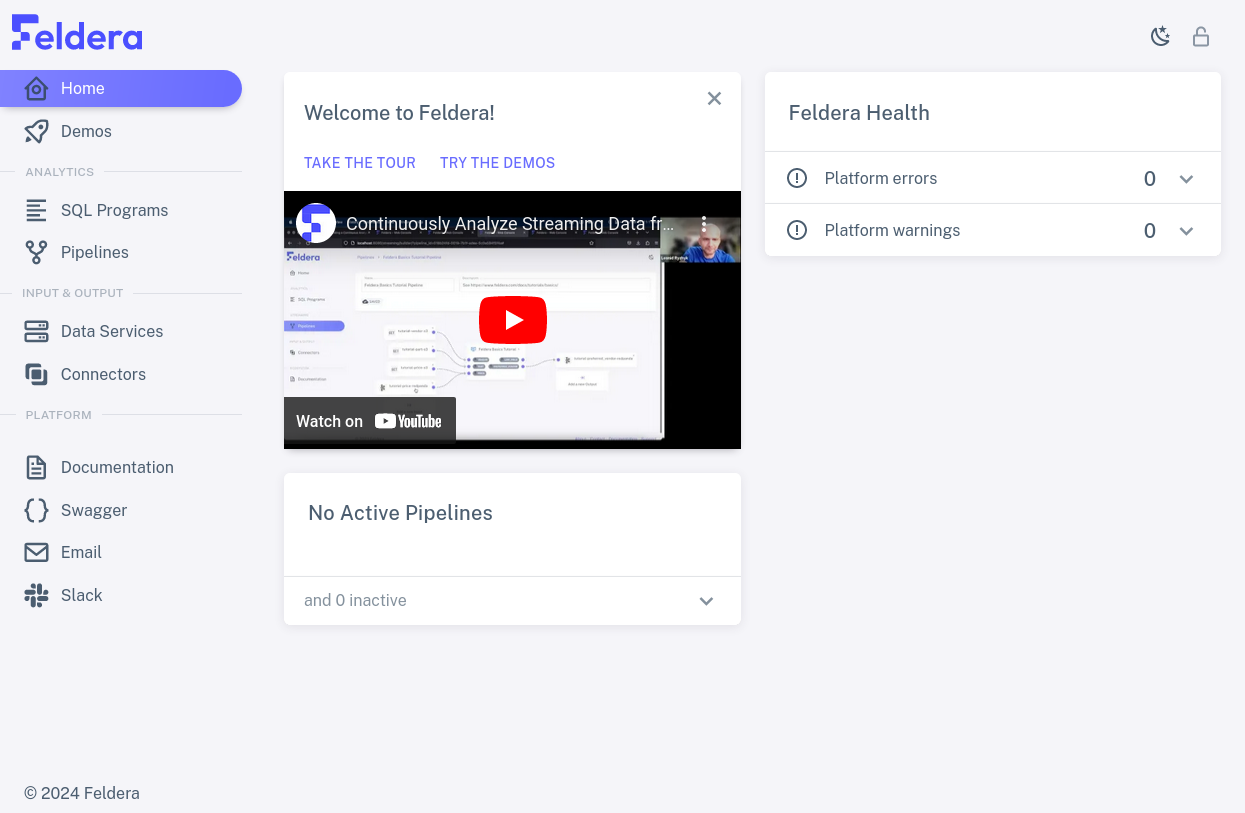
Once you've started the Feldera Platform demo, as described in Get Started, navigate to localhost:8080 in your web browser to view the Feldera Platform user interface. A status dashboard fills most of the home screen, as shown below, and a sidebar on the left offers access to tabs for Feldera Platform features:
Let's take a quick tour around the options on the sidebar.
Analytics

Click on the "SQL Programs" tab. This tab
allows a Feldera Platform user to define the structure of
data and specify analyses. The user writes both of these in SQL: data
definitions as CREATE TABLE commands, and analyses as CREATE VIEW
commands. Feldera Platform implements a rich SQL feature set that permits
sophisticated SQL written for popular SQL databases to run with only
minimal changes.
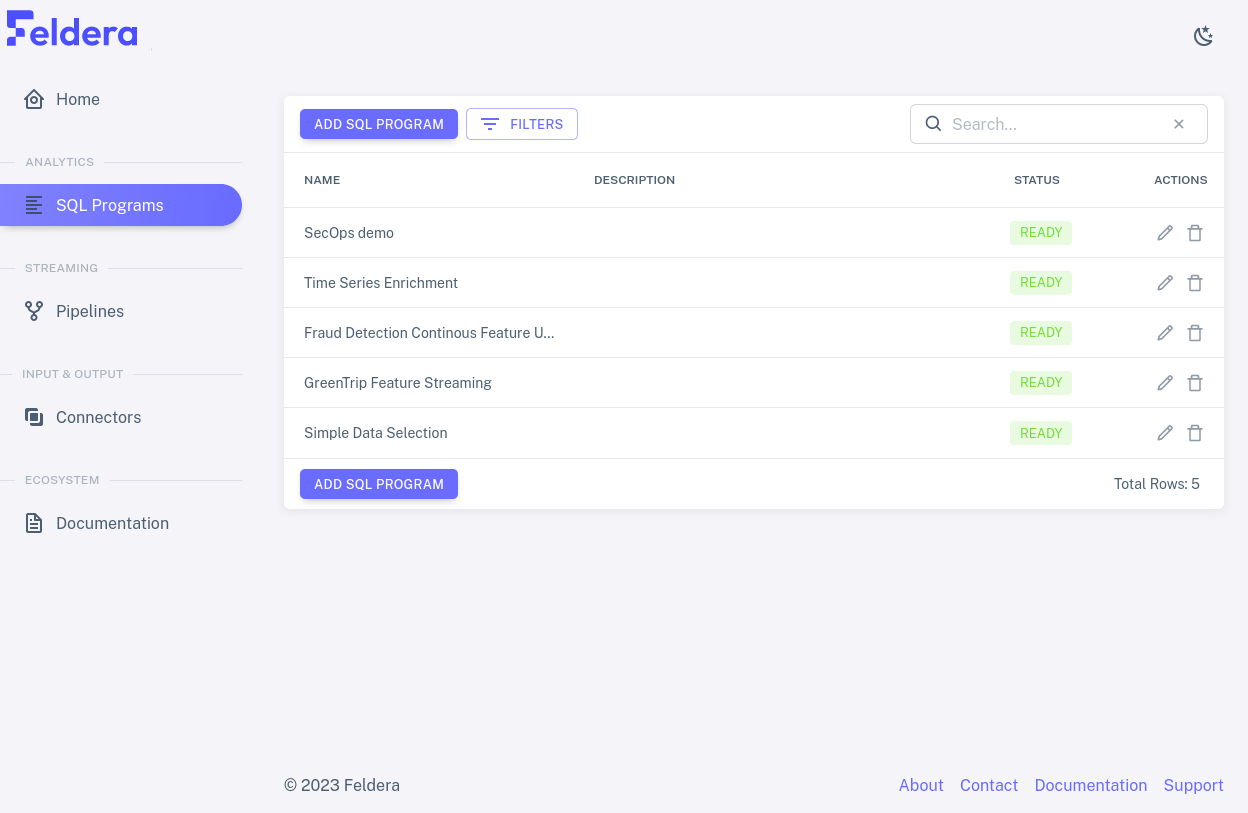
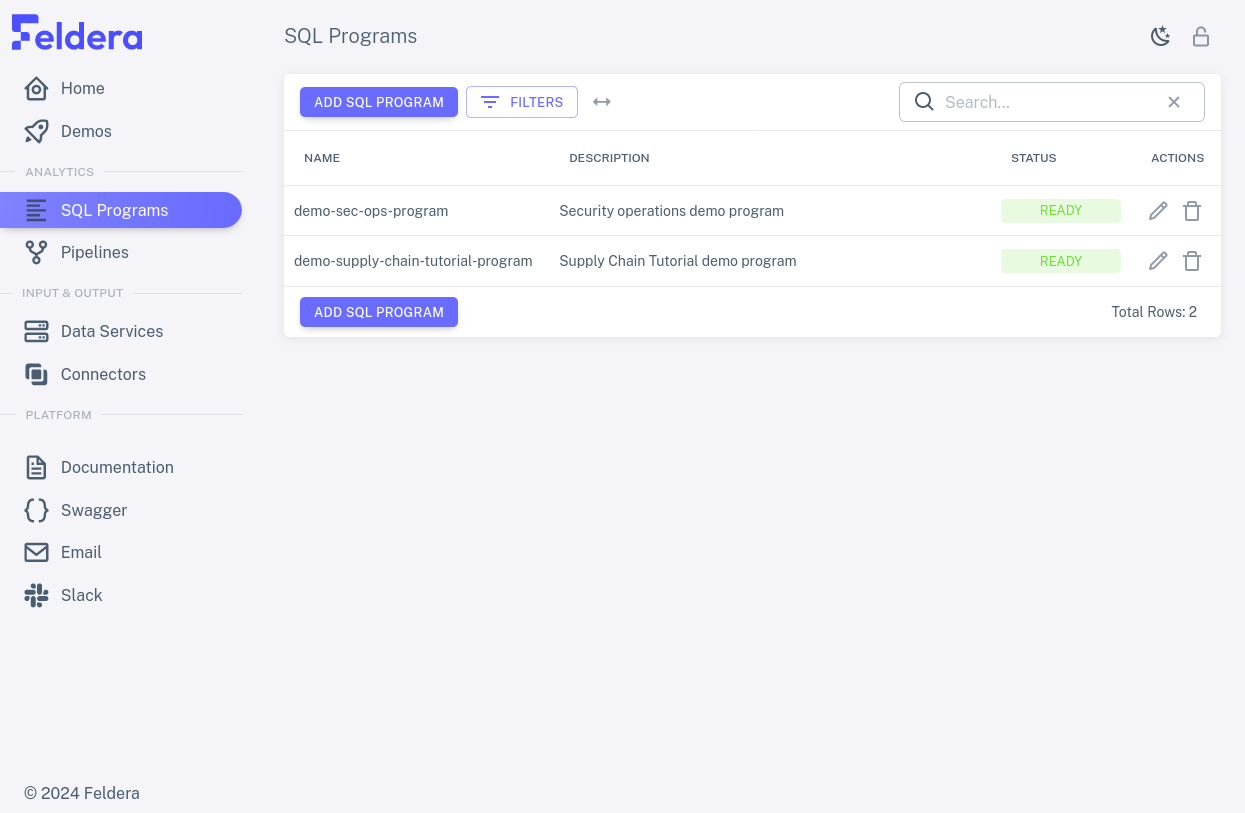
In addition to an "Add SQL Program" button for creating a new program, this tab displays a list of each existing program's name and description, which one may double-click to edit. Each program also has a status that indicates whether it is fully compiled, and two icons for actions: a pencil to view or edit the program's SQL, and a trash can to delete it:
Click on the pencil icon for one of the rows. This brings up the SQL Editor for the selected program, which allows one to edit the program's name and description and code:
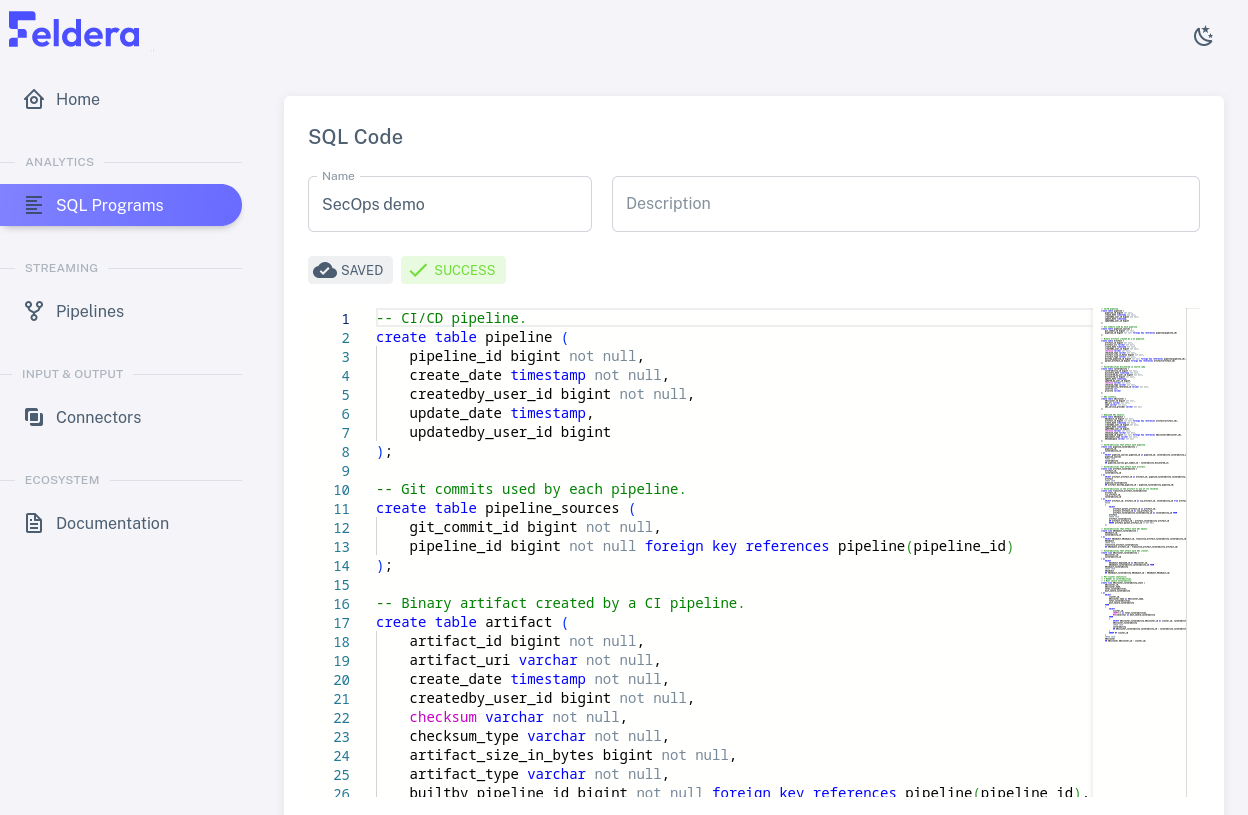
Scroll through the SQL code. It should consist of CREATE TABLE and
CREATE VIEW commands:
CREATE TABLEspecifies a data format. Feldera Platform processes streaming data, rather than storing it, so Feldera Platform does not reserve disk space in response to table definitions.CREATE VIEWdescribes an analysis in terms of tables or views. Feldera Platform updates views whenever it receives new data in a table.
Connectors
![]()
For a Feldera Platform program to be useful, it must be able to access data. This happens through connectors, which are divided into input connectors for obtaining data from a source to feed into a table and output connectors that receive data output by views.
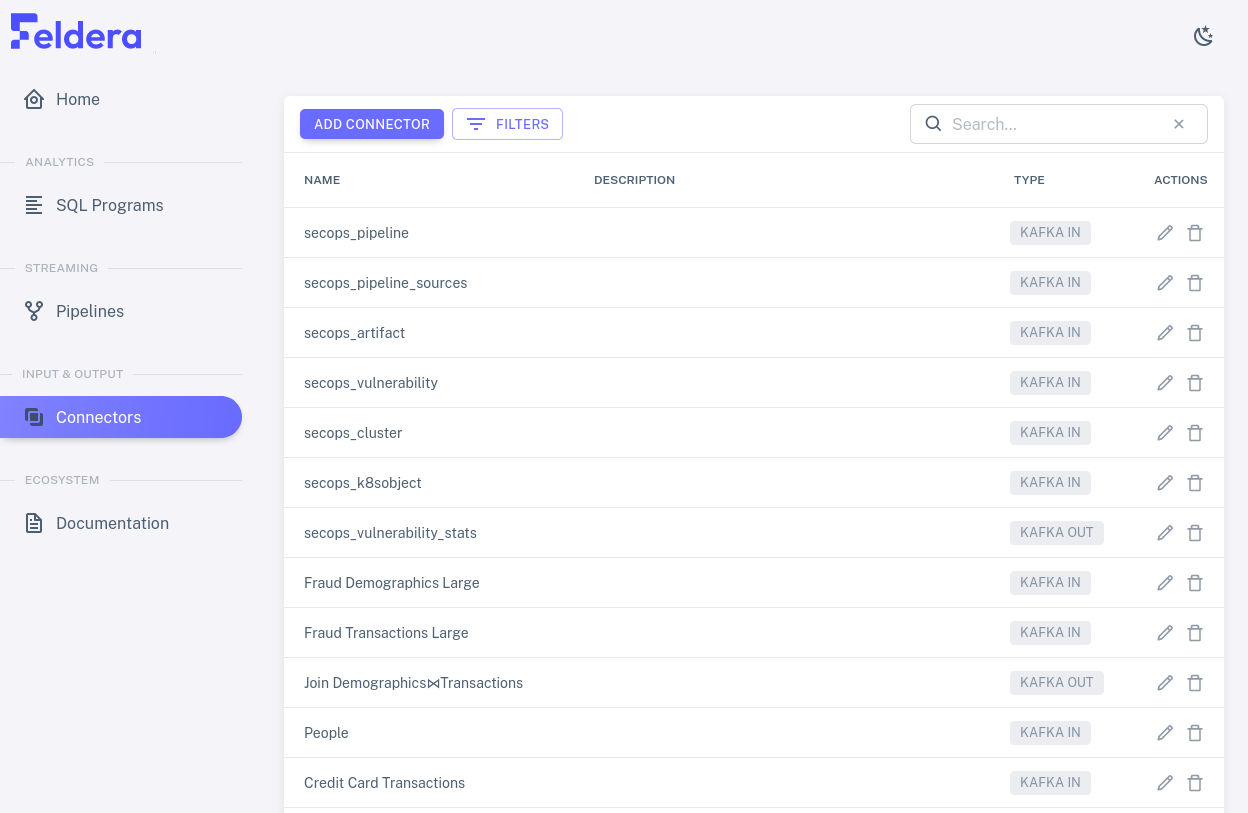
Click on the "Connectors" tab, which allow a user to create and manage input and output connectors. In addition to an "Add Connector" button to create a new connector, this tab shows a list of the input and output connectors that have already been created. The list shows each connector's name and description, which one may double-click to edit, along with its type. Pencil and trash can icons allow one to edit and delete connectors:
Click on one of the pencil icons to see what kinds of settings are available for each connector. The available settings vary with the connector type. The connectors in the demo are already set up properly, so don't make changes.
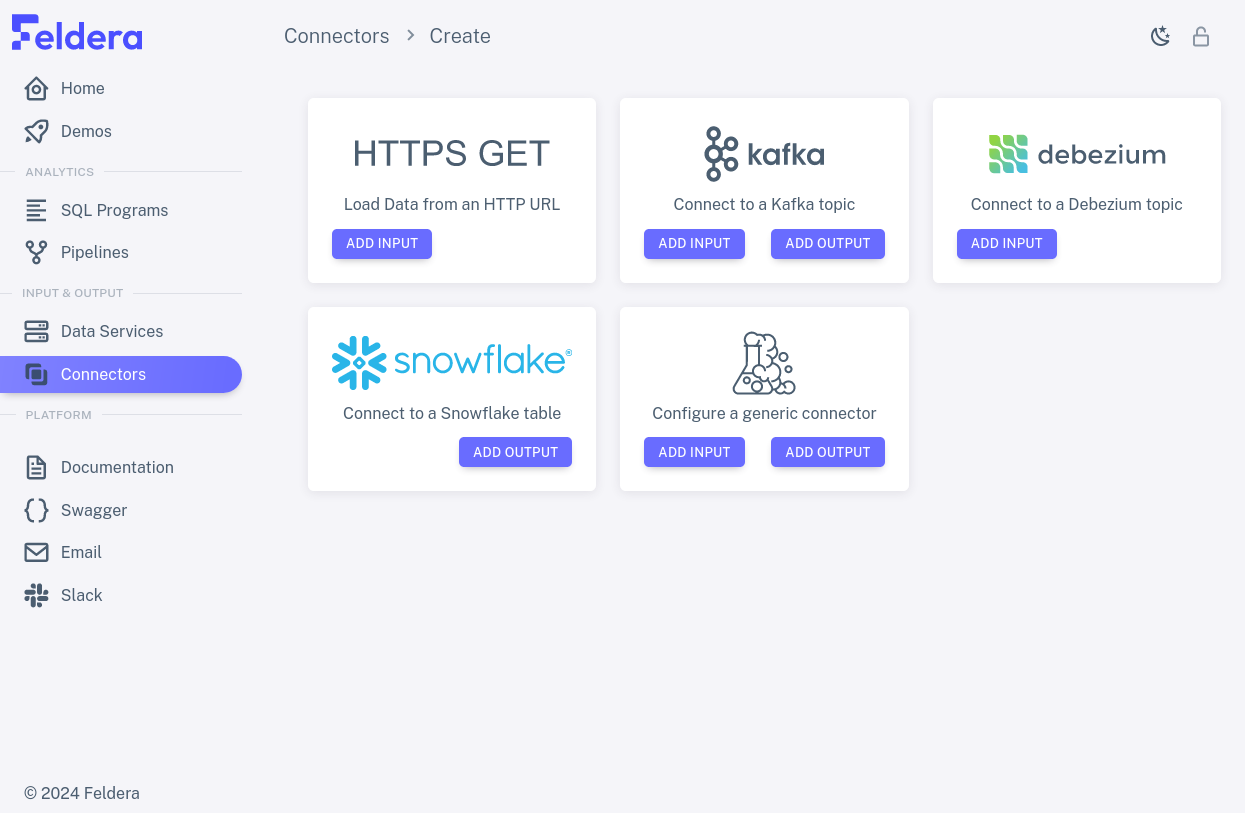
Click on "Add Connector" to see the types of connectors that Feldera Platform supports for input or output or both:
The next section shows how to combine programs and connectors to form streaming pipelines.
Pipelines
![]()
A user assembles a pipeline by attaching a program's tables to input connectors and its views to output connectors. The "Pipelines" page allow a Feldera Platform user to set up, manage and monitor pipelines.
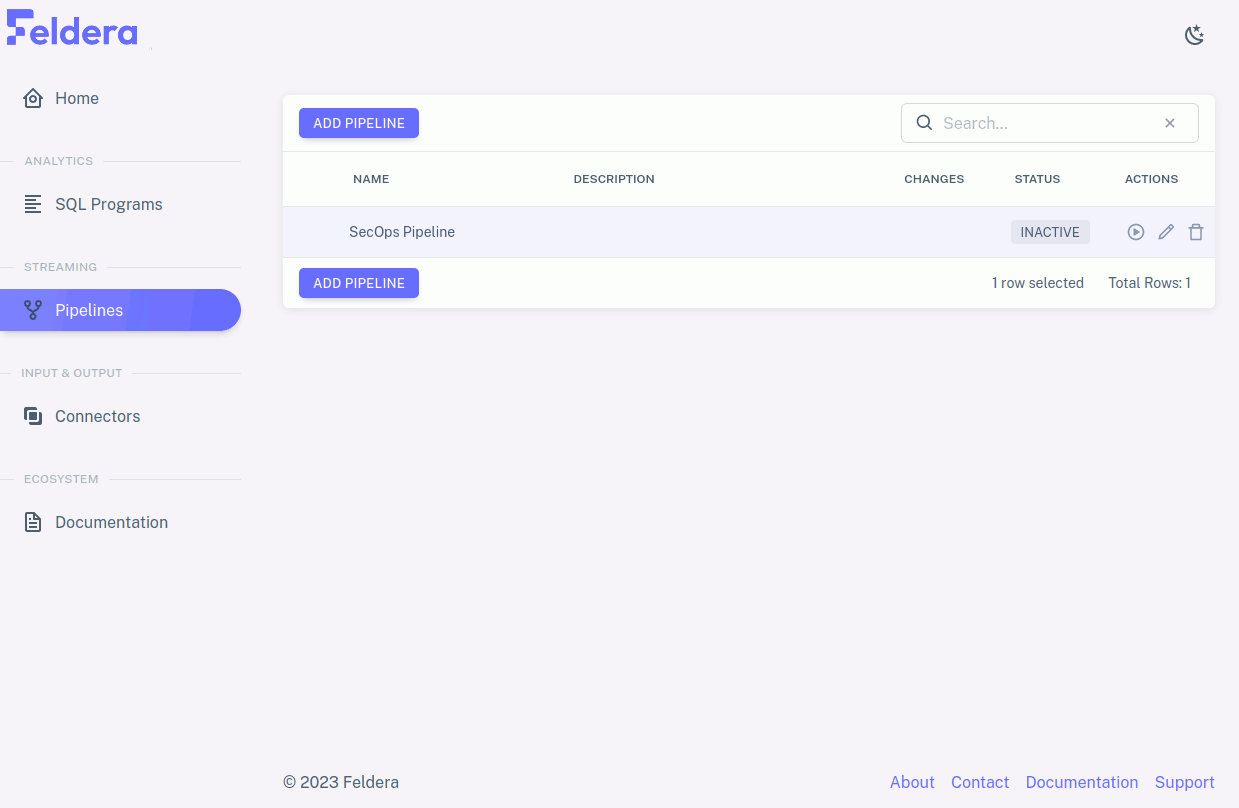
Click on the "Pipelines" tab to see a list of the existing pipelines
as well as an "Add Pipeline" button for creating a new pipeline. Each
row in the list has a
name and description (which one can edit), and an indication of whether the
pipeline is stopped, running, or paused. When you start the demo for the first
time, all of the pipelines should be shown as READY TO RUN, with
available actions the familiar pencil and trash can plus a new one, the play
symbol , which starts the pipeline:
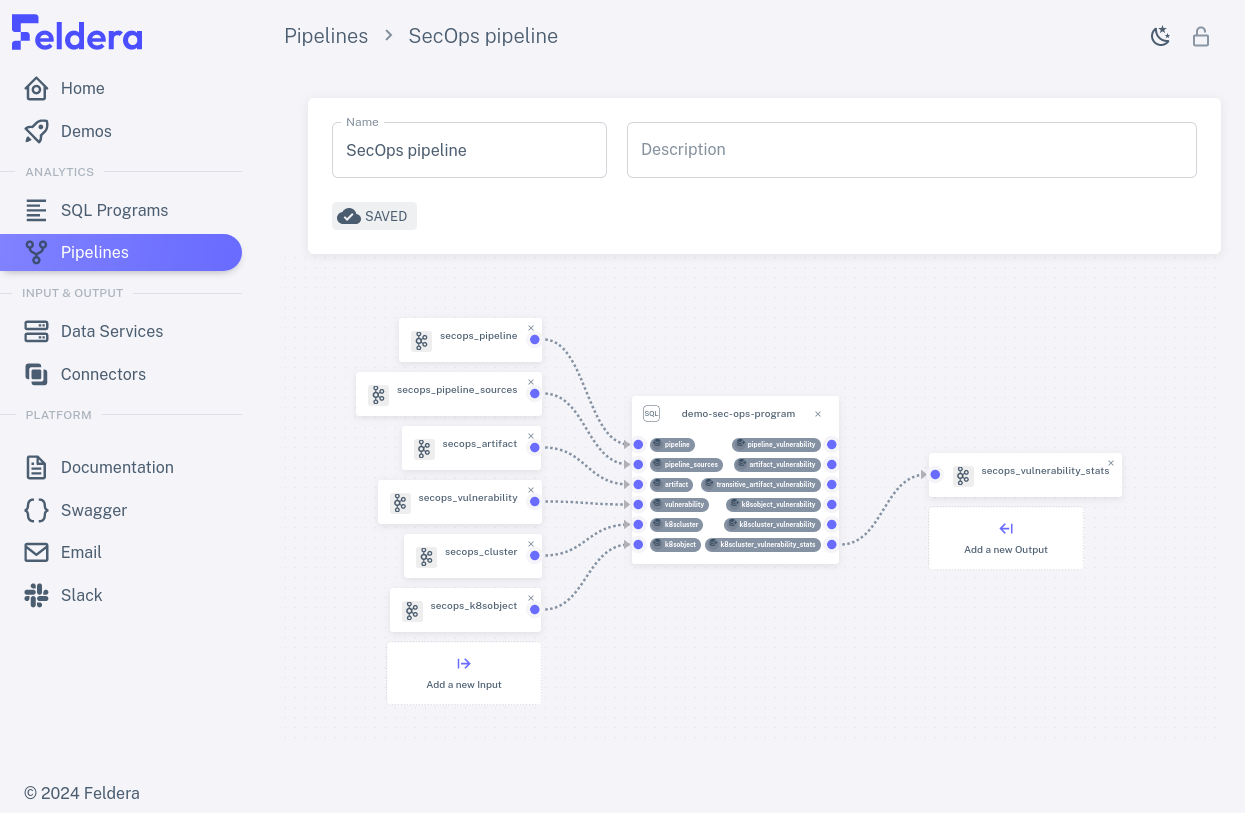
Choose a row and click on its pencil icon to view the pipeline's connector attachments. The box in the middle of the diagram represents the SQL program, listing its tables on the left and its views on the right. Input connectors are listed to the left of the box, output connectors to the right. Curved lines join input connectors with the tables to which they input data and views with the output connectors to which they output data. Tables and views may be left without an attached connector if the pipeline does not need them:
Running a Pipeline
Click on the back button to return to the list of pipelines. Then, click on the
pipeline's play action. The pipeline status should change to STARTING..., then a
few seconds later to RUNNING. Once the pipeline has started, on the left side
of the row, a downward arrow icon
appears. Click it to expand. The expanded row now shows metrics for each SQL
table and view in the pipeline's program, as well as metrics for the pipeline as
a whole.
Depending on the pipeline you selected, data might continue to arrive perpetually or for a long time, and thus the metrics continue to update just as long, or it might be exhausted within a few seconds and the metrics stop changing. The view of the running pipeline should look something like this:
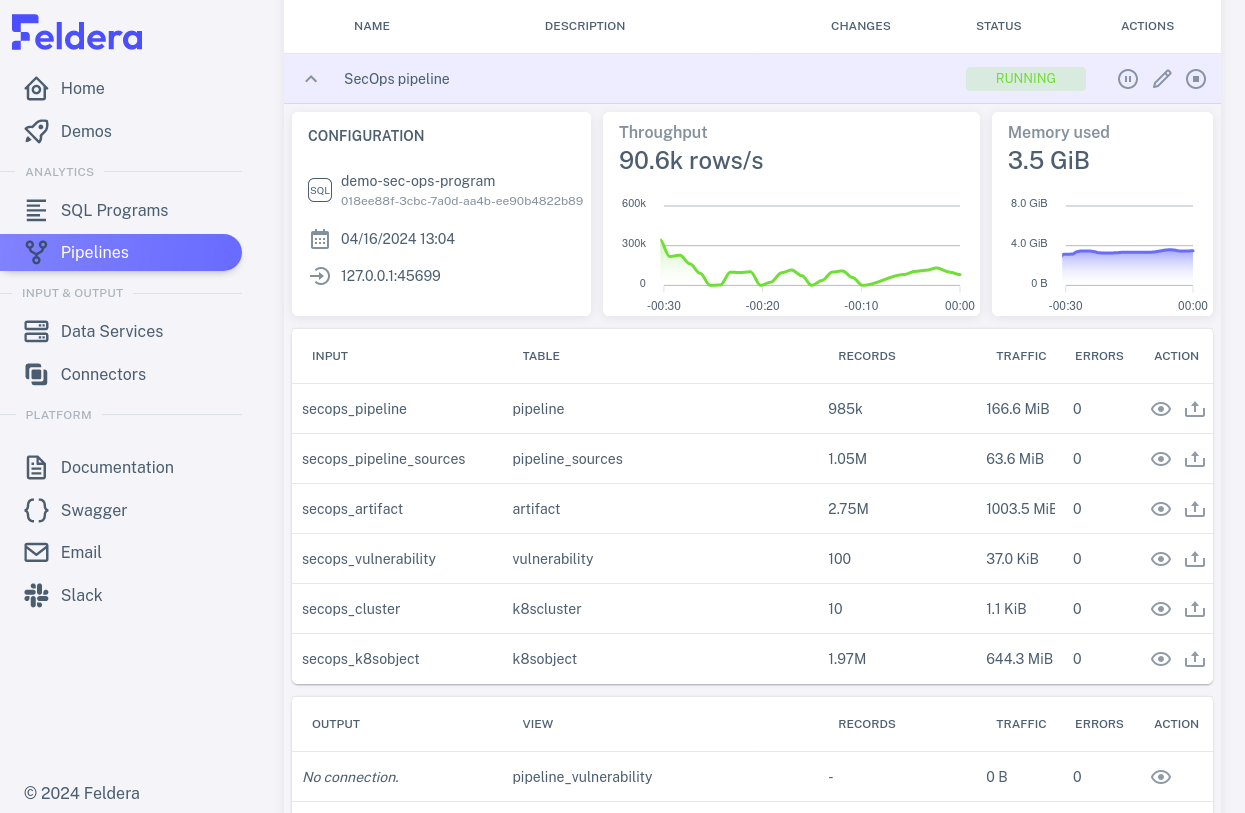
Each row that lists a SQL table or view includes, in addition to names and metrics, an eye icon for an action to view data received or sent through the connector. Click on the eye for some row to see how it works:
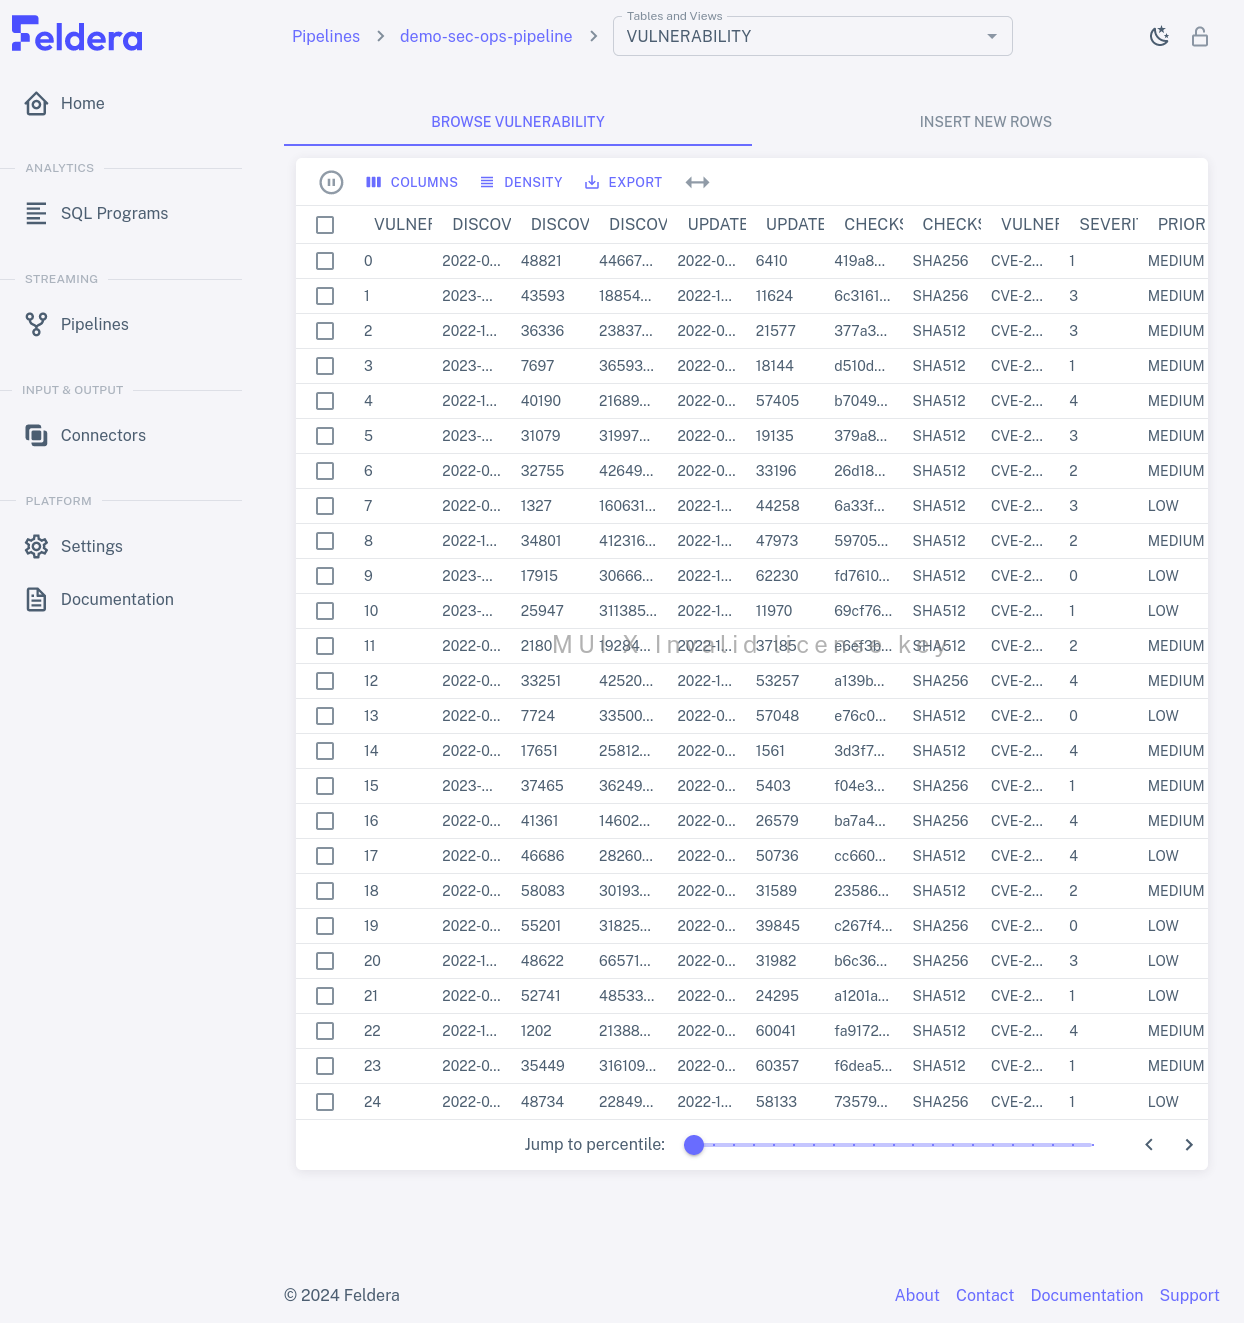
You can browse the table or view by clicking the the next or previous buttons in the bottom right corner of the table. In larger tables or views, a slider appears by the buttons. You can use it to jump to a given percentile in the table by moving the slider to the desired percentile position.
When you're done with the pipeline, you can temporarily pause it by clicking on the pause icon , which replaced the play icon when the pipeline started, and then stop it by clicking on the stop icon that this reveals.
Here's an example of a whole pipeline run: