Demo
This section provides a detailed walkthrough of the "developer security operations" (DevSecOps) scenario included in the demo container. This scenario uses Feldera to analyze streams of data about software as it is transformed from source code to binary artifacts through CI build pipelines and deployed using Kubernetes.
The data streams also report vulnerabilities discovered in software source code. Our goal is to link source code vulnerabilities to the binaries built from them directly or indirectly, to Kubernetes images built using those vulnerable binaries, and to Kubernetes clusters running those vulnerable images.
To follow along, set up the containers using the instructions in Get Started. It's also a good idea to take the Tour to familiarize yourself with Feldera concepts and user interface.
Tables
We'll start by looking at how the DevSecOps demo defines its input
tables using SQL. Fire up the Feldera demo and visit
http://localhost:8080/ to bring up the UI. On the sidebar, click on
"SQL Programs", then find the "SecOps demo" row in the table of
programs and click on the pencil icon . The
SQL create table statements at the top of the program establish the
schema and relationships.
The following list describes the meaning of a record in each table:
pipeline, a run of the CI build system.pipeline_sources, which links apipelinewith the source code that it used.vulnerability, a vulnerability in apipeline_sources.artifact, the output from apipelineand possibly a parentartifact.k8sobject, a Kubernetes image built from anartifact.k8scluster, a deployment of ak8sobject.
To see a visualization of the relationships between tables, expand the following.
E-R diagram
Views
Now let's see how the SQL program uses views to produce output.
Scroll down in the SQL code pane that was already visible, past the
create table statements at the top, until the create view
statements are visible. These statements go beyond what the tables
directly tell us only about vulnerabilities in particular Git commits.
Starting from that information, the views report the following:
pipeline_vulnerability: Vulnerabilities in eachpipeline_sourcesrecord.artifact_vulnerability: Direct vulnerabilities in eachartifact.transitive_artifact_vulnerability: Vulnerabilities in eachartifactor its chain of parents.k8sobject_vulnerability: Vulnerabilities in eachk8sobject.k8scluster_vulnerability: Vulnerabilities in eachk8scluster.k8sobject_vulnerability_stats: Statistics about vulnerabilities.
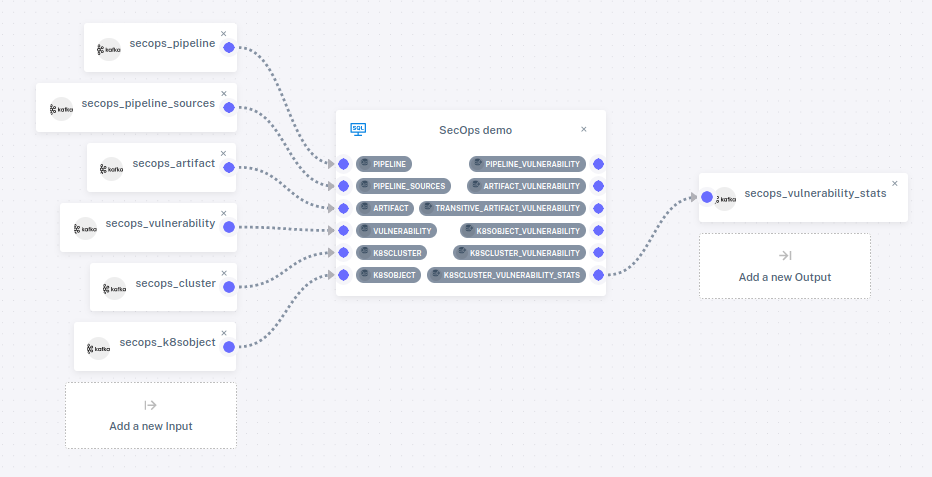
To see a visualization of the relationships between tables and views, expand the following, which shows table names in lowercase and view names in uppercase:
E-R diagram of tables and views
Pipeline
To view the DevSecOps pipeline, on the sidebar, click on Pipelines, then on the pencil icon next to SecOps Pipeline. This displays the pipeline structure, including the program and how it is attached to connectors:
Only one of the views is attached to an output connector. Attaching tables and views to connectors is optional. An unattached table won't receive any data, and an unattached view won't send its output anywhere. We can still add data to tables and see the output to views in the web console.
Connectors
We saw the pipeline's input and output connectors. Let's take a closer look.
Click on "Connectors" on the sidebar to bring up the list of connectors. Now the input and output connectors in the pipeline are listed in a table:
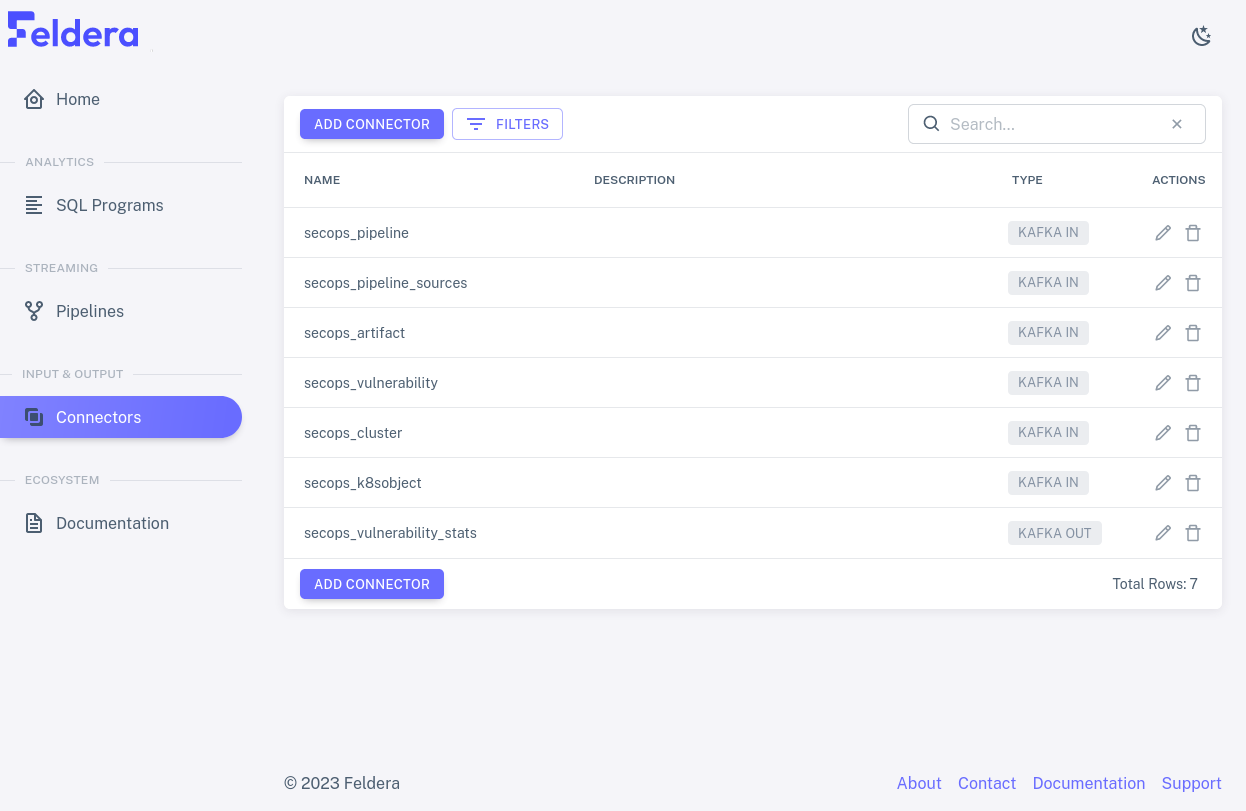
Input connectors
Let's look at an input connector. We can tell that most of the rows
in the list are input connectors because their TYPE is shown as
KAFKA IN. Click on the pencil icon on the
secops_pipeline row. A dialog should pop up like the one below,
which allows the input connector's name and description to be edited.
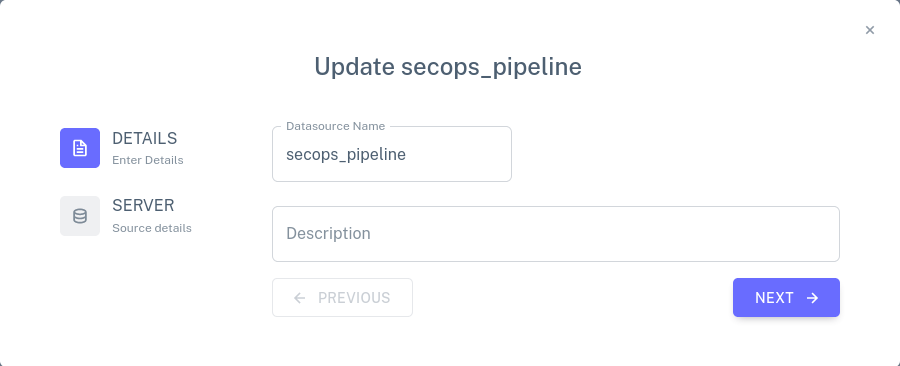
Click on the Next button to bring up a second dialog for the connector. This dialog allows the connector's Kafka connection details to be updated: one can specify how to connect to the Kafka server, whether to read all of the data or only newly arriving data, and which Kafka topics to read.
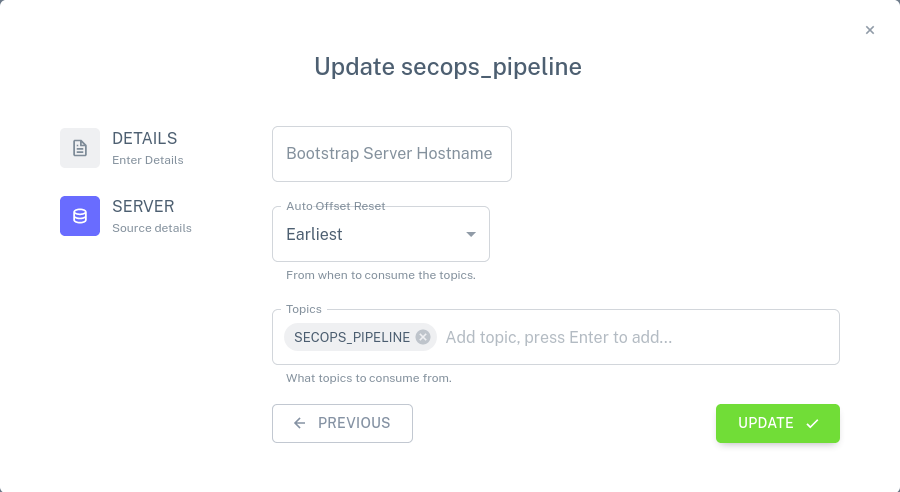
Close the dialog without making any changes, by clicking on the X in the upper-right corner.
Output connector
Now let's look at the output connector. The only output connector on
the list is secops_vulnerability_stats. Click on the pencil
icon on its row. This brings up a dialog
like the one for an input connector:
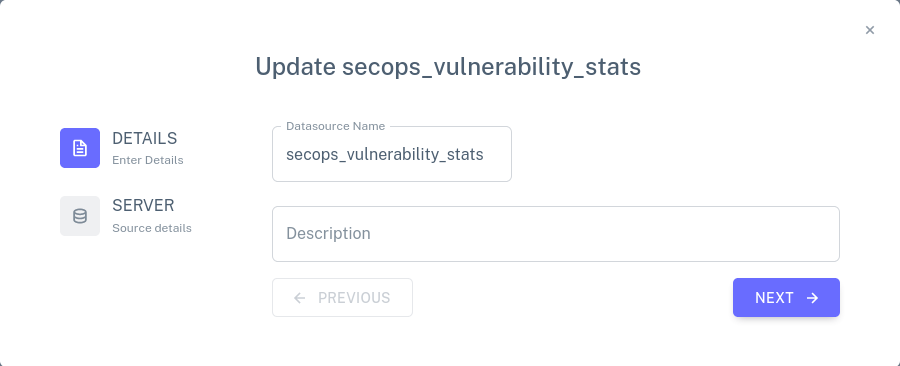
Click on the Next button to bring up a second dialog. Here, one may specify how to connect to a Kafka server, as for a Kafka input connector, and the name of a topic.
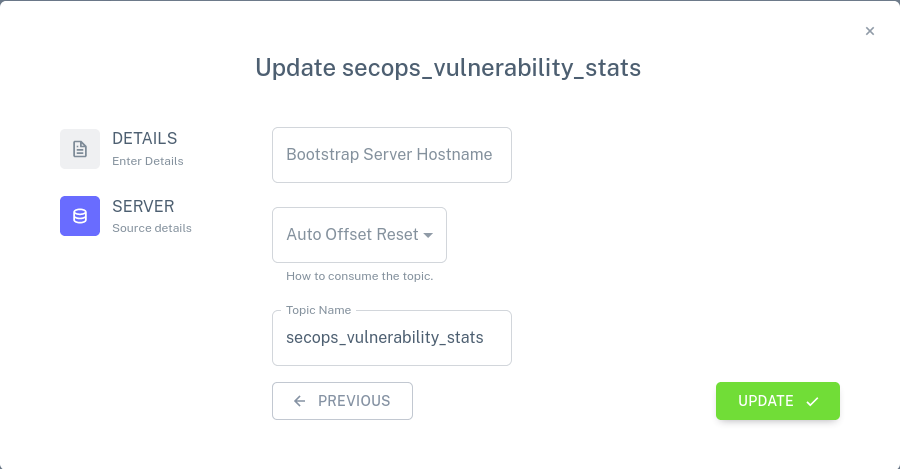
Close the dialog without making any changes, by clicking on the X in the upper-right corner.
Running the Pipeline
Let's take a look at how the vulnerability statistics can evolve as we
feed data into the pipeline. From the Pipelines tab, click on the
play icon. Wait a few seconds for the pipeline to start running, then
click on to expand the
list of input and output connectors, then on the eye on the row for
K8SCLUSTER_VULNERABILITY_STATS. The page refreshes to show the data
in the view. It should look something like this:
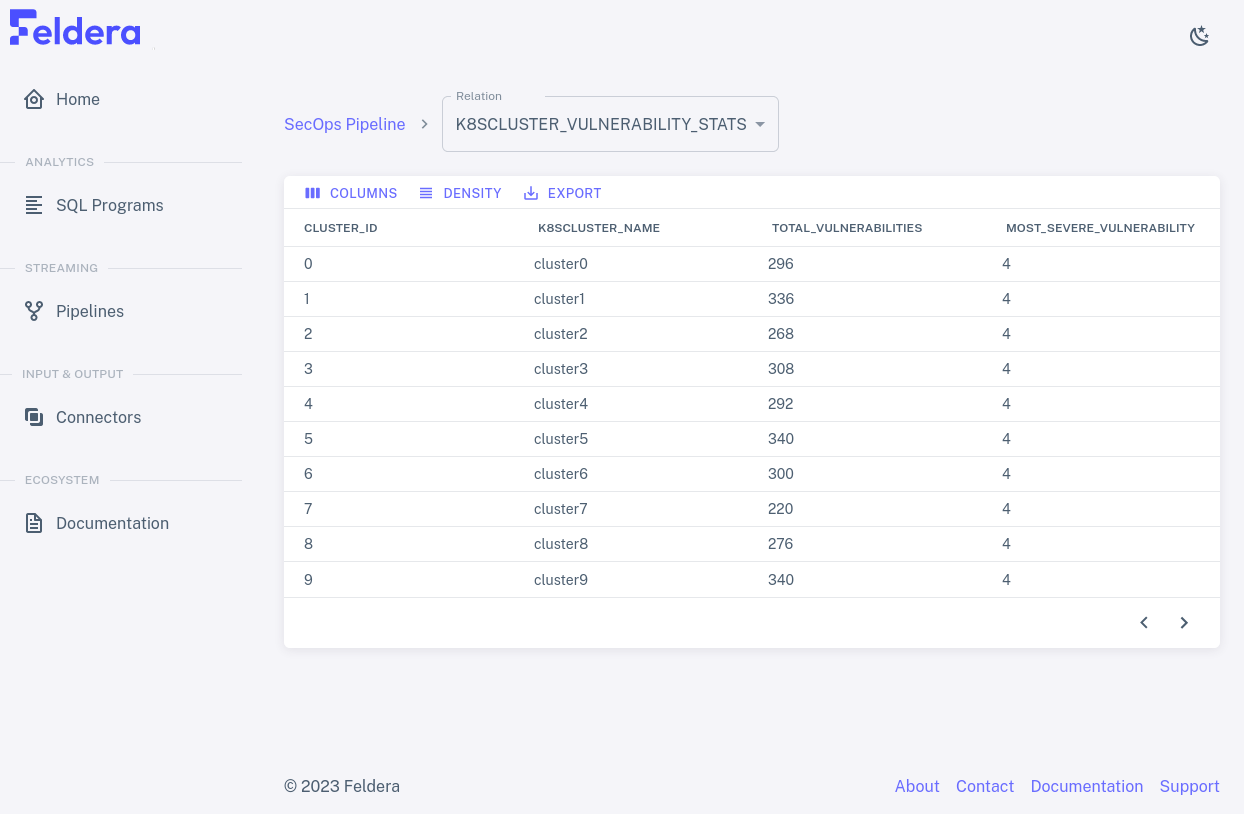
The data on the page should refresh periodically, with the numbers changing each time.
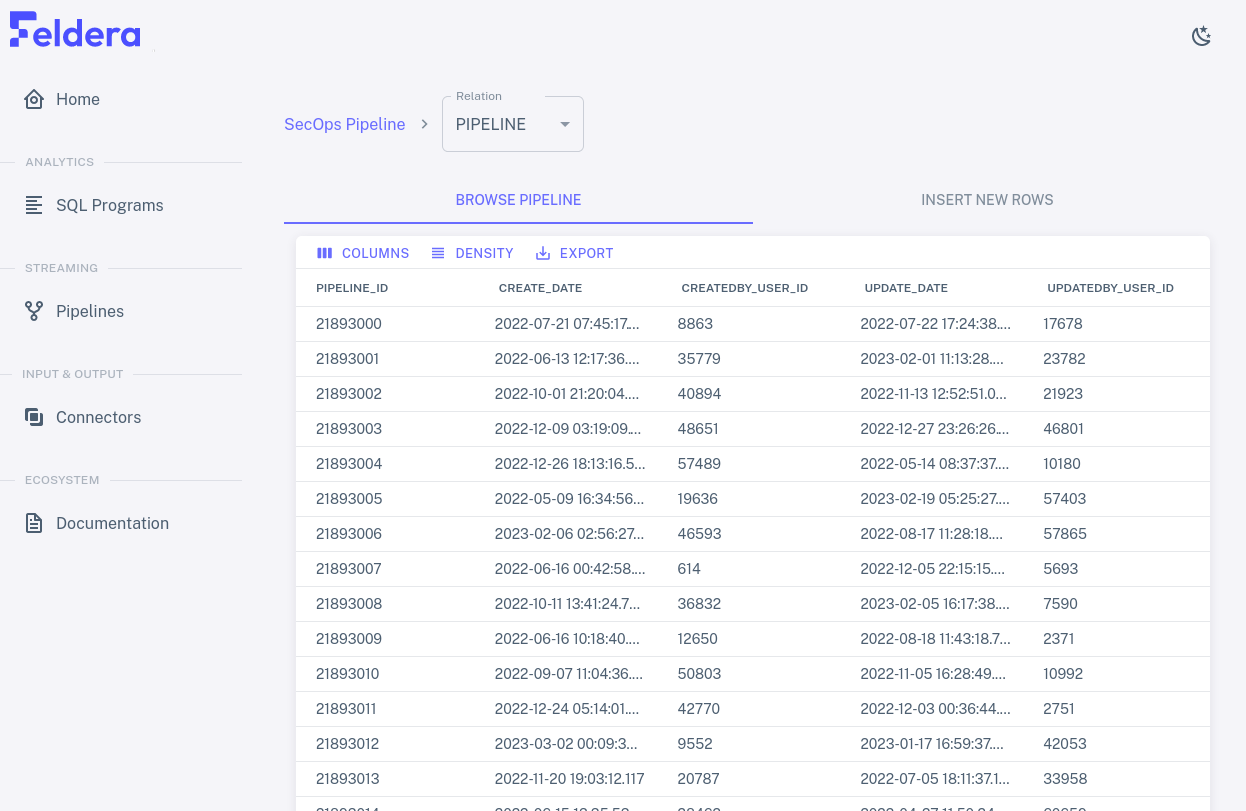
You can view input to other tables and output to other views by
selecting them from the Relation drop-down at the top of the page. If
you select PIPELINE, for example, you should see fast-changing data
similar to the following: