When a Feldera pipeline fails or gets interrupted, the first question is always: what just happened? Is there a bug? Did I configure something wrong? Or did something happen in the underlying Kubernetes cluster?
If you don’t have direct access to Kubernetes, you’re left guessing, and even with access, figuring out what happened requires knowing where to look.
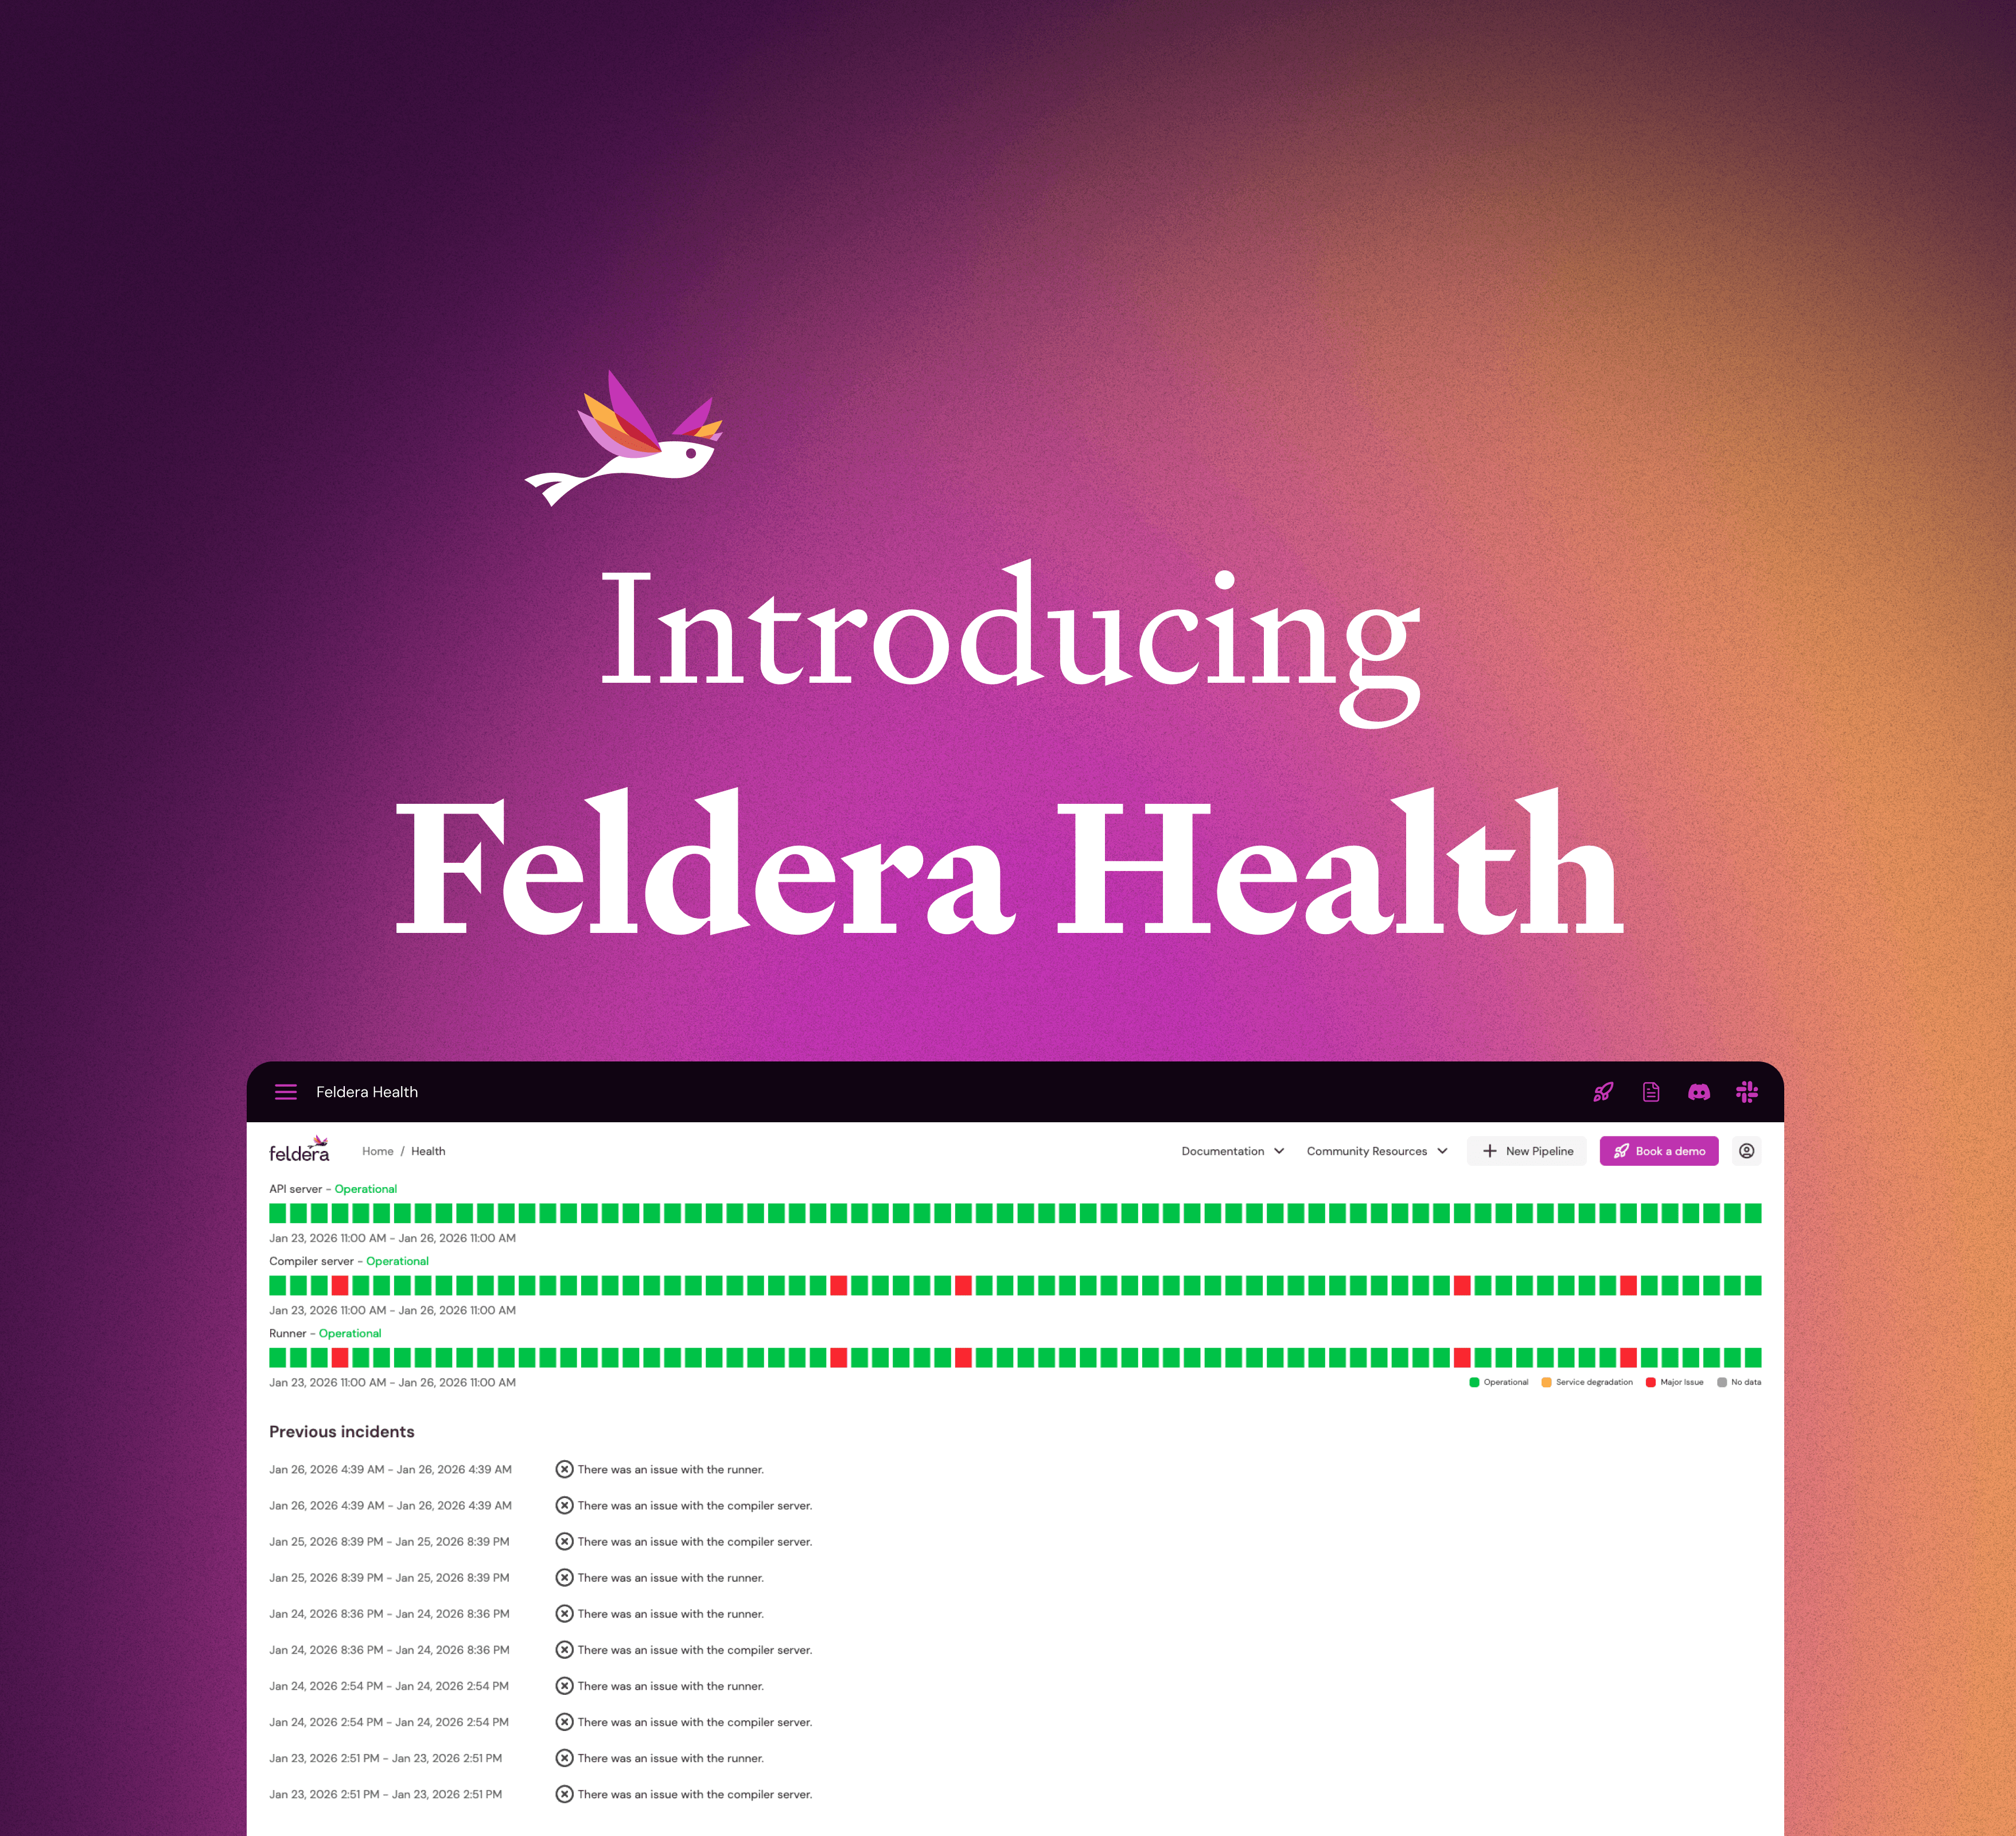
Feldera’s Health Page gives you quick answers. It’s a lightweight health dashboard built directly into Feldera that shows the status of your infrastructure at a glance. When something goes wrong like a spot instance gets replaced, you’ll see it immediately.

You get the real-time status of your control plane components (compiler, API server, runner), and soon the health status for your individual pipelines. A 72-hour timeline shows what happened and when, giving you historical context without requiring kubectl commands or waiting on another team.

Real-world impact
Within minutes of upgrading to the latest version, one Feldera customer used Feldera Health to discover they were experiencing more control-plane evictions than normal due to Karpenter, an issue that would have taken hours to diagnose through traditional debugging.
In larger organizations, teams don’t always have access to the Kubernetes clusters where Feldera runs. Instead of raising tickets and waiting for DevOps, you can now quickly check if an infrastructure issue is affecting your work.
Feldera Health gives you the most critical information immediately, bridging the gap between manual debugging and enterprise observability tools.
Available today on try.feldera.com and Feldera’s Enterprise Edition.